The Geoeconomic Interconnectivity Index

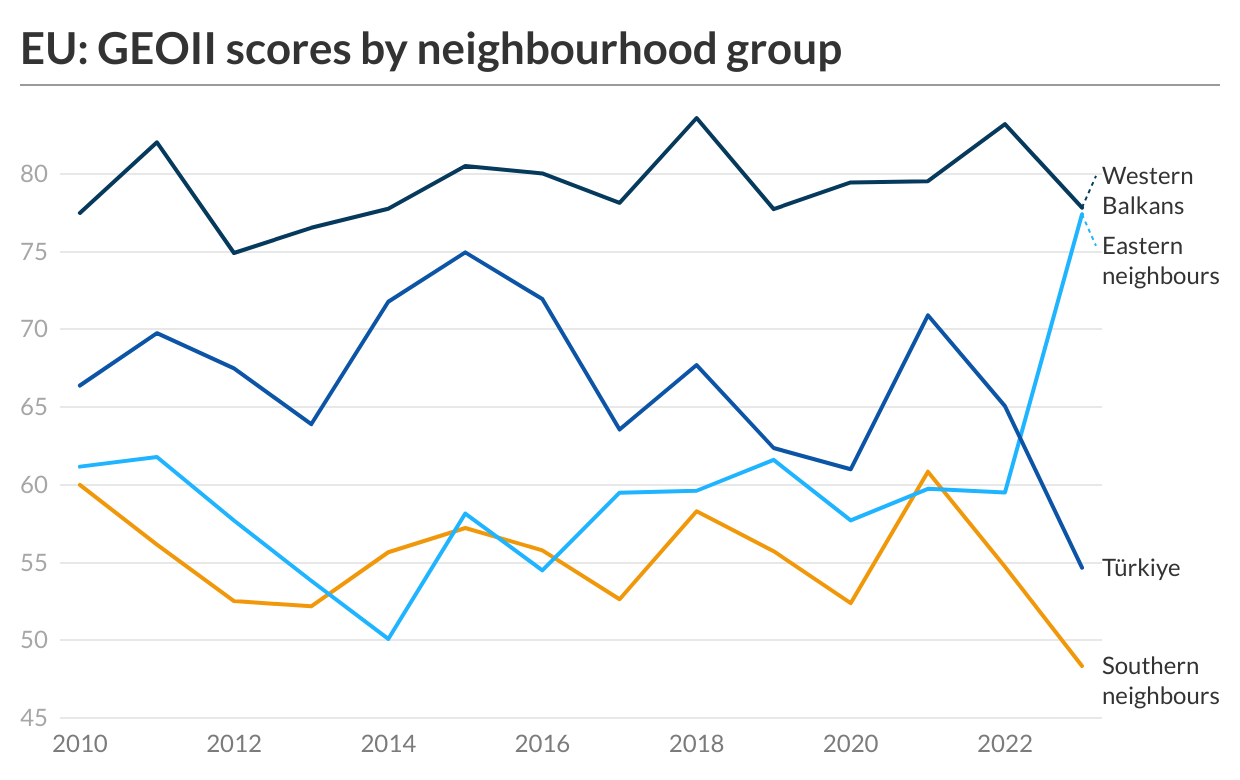
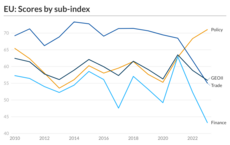
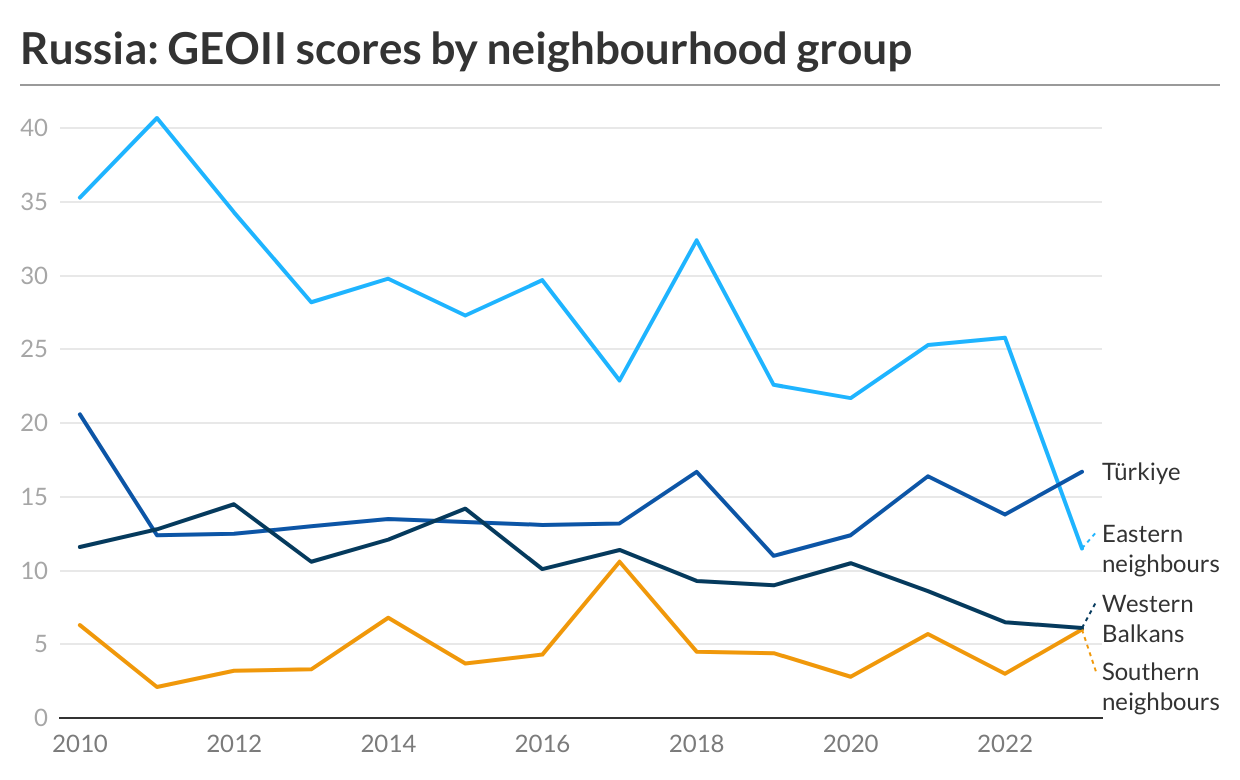
In today’s European neighbourhood, trade, investment, and economic policy have become deeply entangled with geopolitical competition — involving the EU, the United States, China, and Russia as leading geoeconomic actors. The Geoeconomic Interconnectivity Index brings together a wide range of indicators across trade, investment, and economic policy in an accessible, comparable format. Covering the years 2010 to 2023, it provides a clear picture of evolving patterns of economic engagement.

The Index is designed to support timely and informed debate on the EU’s external policies — offering insights that matter in a geoeconomic age.

Explore the geoeconomic interconnectivity of the EU, the United States, China, and Russia

This section allows you to explore how the EU, United States, China, and Russia have engaged economically with the European neighbourhood between 2010 and 2023. You can browse the Index by sub-indices — trade, finance, and policy — as well as by individual indicators. Choose the powers, countries, and time periods that interest you. Results can be displayed as a line chart or in table format, and a ranking view shows how each power compares over time. It is updated anually.

Further details on the indicators and methodology can be found here and here. The underlying dataset can be downloaded here

Reset

Ranking {{ rankingWithYear.year }}

  • {{ index + 1 }}. {{ item.text }}

No ranking available for the selected parameters.

For your selection, some lines overlap because they have the same values.

Play Download

Geoeconomic interconnectivity by EU neighbouring country and region

The spider chart shows how the EU, United States, China, and Russia are economically connected with each of the 21 EU neighbouring countries in a selected year. The countries are grouped into four regions: Western Balkans, EU Neighbourhood South, EU Neighbourhood East, and Türkiye.  You can choose between sub-indices (trade, finance, policy) and explore specific indicators. Please note that this chart displays data year by year and does not allow for viewing trends across multiple years. 

No data available for the selected year. Please select the previous year to view results.
Play Download

Striking patterns in geoeconomic interconnectivity

While the EU remains the most interconnected power across its neighbourhood, the Geoeconomic Interconnectivity Index (GEOII) reveals growing pressures on that position. China is expanding its influence, particularly through trade and infrastructure investment; Russia continues to exert disruptive pressure despite steep declines in connectivity; and the US is stepping back economically, even as it retains selective influence. 

The charts below highlight some of the most telling trends — where the EU’s lead is shrinking, where rivals are gaining ground, and where interconnectivity is shifting in ways that demand closer attention. 

EU GEOII scores by sub-index

Policy Alignment Alone Won’t Safeguard the EU’s Economic Position

The EU has deepened policy connectivity with its neighbours in recent years, surpassing Russia. Yet this has not reversed declining trade and financial ties.